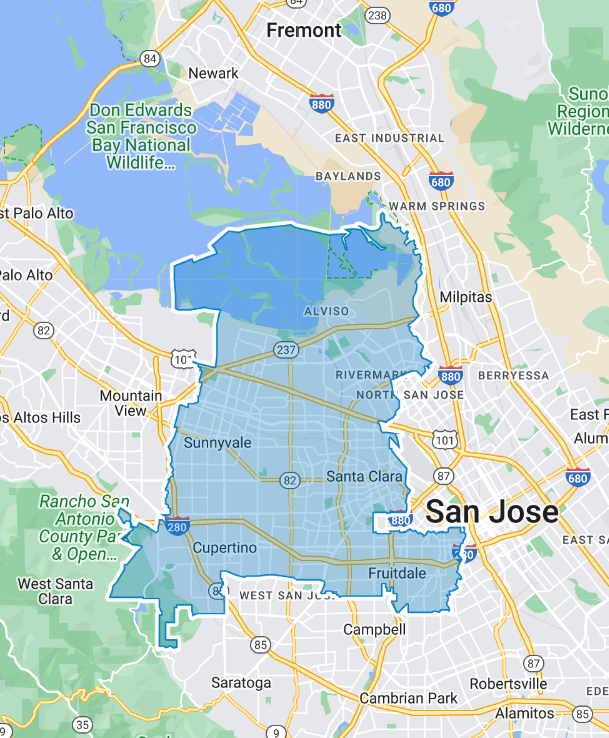
District Information

DISTRICT AD26
2020 Census Population (adj Elec. §21003)
| Name | Count | Percent |
|---|
| Total Population (POP) | 472,660 | 100.00% |
|---|
| POP Hispanic or Latino | 84,697 | 17.92% |
|---|
| POP Not Hispanic or Latino (NH) | 387,963 | 82.08% |
|---|
| POP NH Population of one race | 369,416 | 78.16% |
|---|
| POP NH White alone | 128,966 | 27.29% |
|---|
| POP NH Black or African American alone | 9,954 | 2.11% |
|---|
| POP NH Asian alone | 225,839 | 47.78% |
|---|
| POP NH American Indian and Alaska Native alone | 648 | 0.14% |
|---|
| POP NH Native Hawaiian and Other Pacific Islander alone | 1,391 | 0.29% |
|---|
| POP NH Some Other Race alone | 2,618 | 0.55% |
|---|
| POP NH Population of two or more races | 18,547 | 3.92% |
|---|
2020 Census Housing Occupancy Status
| Name | Count | Percent |
|---|
| Total Housing Units | 188,077 | 100.00% |
|---|
| Occupied | 177,476 | 94.36% |
|---|
| Vacant | 10,601 | 5.64% |
|---|
2020 Census Group Quarters Population (adj Elec. §21003)
| Name | Count | Percent |
|---|
| Total Group Quarters Population: | 6,600 | 100.00% |
|---|
| Institutionalized population: | 2,203 | 33.38% |
|---|
| Correctional facilities for adults | 0 | 0.00% |
|---|
| Juvenile facilities | 52 | 0.79% |
|---|
| Nursing facilities/Skilled-nursing facilities | 2,017 | 30.56% |
|---|
| Other institutional facilities | 134 | 2.03% |
|---|
| Noninstitutionalized population: | 4,397 | 66.62% |
|---|
| College/University student housing | 2,819 | 42.71% |
|---|
| Military quarters | 0 | 0.00% |
|---|
| Other noninstitutional facilities | 1,578 | 23.91% |
|---|
Counties In District
| Name | Count | Percent |
|---|
| Santa Clara | 472,659 | 24.36% |
|---|
Places In District
| Name | Count | Percent |
|---|
| SANTA CLARA: Burbank(U) | 4,954 | 100.00% |
|---|
| SANTA CLARA: Cupertino(C) | 60,446 | 100.00% |
|---|
| SANTA CLARA: Fruitdale(U) | 990 | 100.00% |
|---|
| SANTA CLARA: San Jose(C) | 121,976 | 12.01% |
|---|
| SANTA CLARA: Santa Clara(C) | 127,853 | 100.00% |
|---|
| SANTA CLARA: Sunnyvale(C) | 156,033 | 100.00% |
|---|
| SANTA CLARA: Remainder of Santa Clara(R) | 407 | 1.44% |
|---|


